

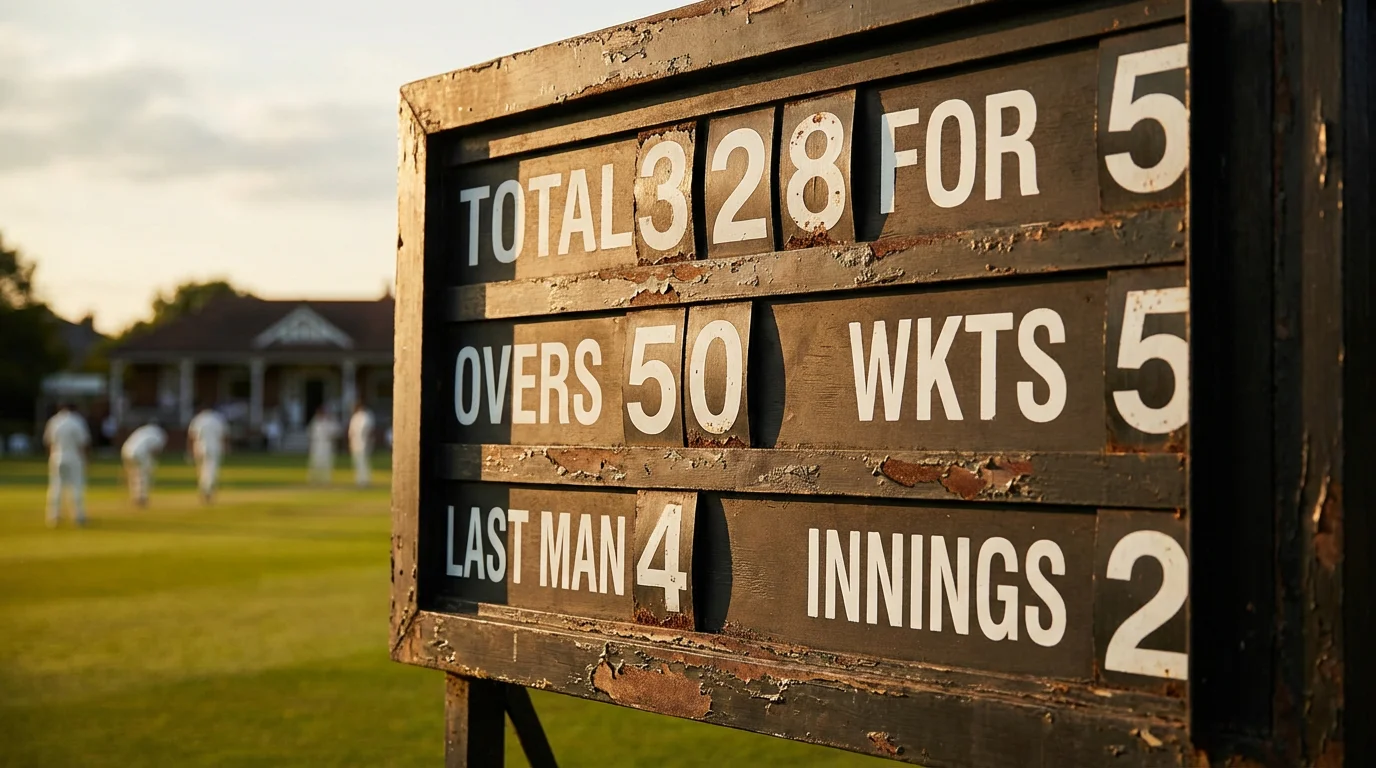
Every ball in a professional cricket match generates data. The speed of the delivery, the line and length, the shot played, the runs scored, the fielder who collected, the wagon wheel direction — all of it is captured, catalogued, and available in real time. For the casual viewer, this data scrolls across the bottom of the screen as background information. For the bettor, it is the raw material from which edges are built.
The challenge is not access. Ball-by-ball data is freely available on platforms like ESPNcricinfo, Cricbuzz, and official ICC apps. The challenge is knowing which statistics matter for which betting decisions, how to read them quickly during live play, and when a statistical signal is strong enough to justify placing a bet. Most cricket bettors either ignore statistics entirely — relying on instinct and name recognition — or drown in data without extracting anything actionable. The productive middle ground is to focus on a small number of high-impact statistical indicators and learn to read them fluently.
This guide identifies the specific statistics that matter most for live cricket betting, explains how to interpret them in real time, and shows how to translate numbers into odds assessments.
See also how pitch conditions affect odds.
Run Rate and Required Rate: The Foundation of Live Betting
The current run rate and the required run rate are the two most fundamental statistics in live cricket betting. The current run rate tells you how fast the batting side is scoring. The required rate, available only in the second innings, tells you how fast they need to score to win. The relationship between these two numbers is the single most important input for the match winner market during a chase.
When the current rate exceeds the required rate, the chasing team is ahead of the game. When the required rate exceeds the current rate, they are falling behind. The gap between the two is the key metric — not the absolute numbers. A required rate of 8.0 is manageable if the current rate is 8.5 but alarming if the current rate is 6.0. The wider the gap, the more the match winner probability shifts toward the bowling side.
What makes this pair of statistics so valuable for betting is that the market does not always respond proportionately to changes in the gap. A single big over — fifteen runs with two sixes — can close a run-rate gap dramatically, causing the chasing team’s odds to shorten. But if the big over was hit off the weakest bowler in the attack and the next bowler to come on has an economy rate three runs per over lower, the gap is likely to reopen. Reading the run-rate gap in context, rather than taking it at face value, is the analytical skill that separates profitable live bettors from reactive ones.
The required rate also interacts with the phase of the innings. A required rate of 9.0 per over after fifteen overs of a T20 is manageable because the death overs naturally produce higher scoring rates. The same required rate after fifteen overs of an ODI is more challenging because there are thirty-five overs remaining and the middle overs typically produce lower rates. Format-specific benchmarks for sustainable required rates are essential reference points for live betting.
Wagon Wheels and Scoring Zones: Reading the Batsman
A wagon wheel is a visual representation of where a batsman has scored his runs — which directions he has hit the ball and how far. For live betting, the wagon wheel is an underused tool that reveals patterns the scorecard cannot show.
If a batsman’s wagon wheel shows heavy scoring through the off side but nothing on the leg side, the bowling captain will eventually set a field to plug the off side and challenge the batsman to score on his weaker side. When that field adjustment happens, the batsman’s scoring rate drops, the run-rate gap widens, and the match winner odds shift — but the shift happens after the field change, not before. The bettor who reads the wagon wheel and anticipates the tactical adjustment can position themselves before the odds move.
Wagon wheels also reveal vulnerability. A batsman who has scored thirty runs but has not hit a single ball through the covers might be uncomfortable against deliveries outside off stump. If the bowling side has not yet exploited this — perhaps because they have been bowling at the body — the vulnerability exists but has not yet been tested. When the bowling changes to target that zone, the dismissal probability rises. For the next wicket market, the wagon wheel’s gaps are as informative as its scoring areas.
The limitation of wagon wheels is that they show where the batsman has scored but not where he has missed or edged. A batsman might have a clean wagon wheel with runs all around the ground but have been beaten six times outside off stump. The wagon wheel alone does not capture that risk. Combining the wagon wheel with a count of false shots — plays and misses, edges, and beaten bats — gives a more complete picture of a batsman’s true position.
Bowling Speed and Variation Data: The Bowler’s Fingerprint
Live bowling statistics — speed, line, length, variation — are displayed on most broadcast graphics and are available in real time on statistical platforms. For live betting, the most useful bowling data point is not the raw speed but the variation in speed within a spell.
A fast bowler who delivers every ball between 140 and 145 kilometres per hour is consistent but predictable. A bowler who mixes deliveries at 142, 128, and 135 is harder for the batsman to time, because the speed variation disrupts the batsman’s rhythm. Variation in pace is a stronger predictor of wicket-taking in the death overs than raw speed, because it is the change of pace — not the pace itself — that induces mistimed shots and false strokes.
For the next wicket market and the session wickets market, tracking a bowler’s speed variation within the current spell is more informative than his career economy rate. If a bowler has been hitting the same speed consistently for two overs and the batsman has adjusted, the bowler’s threat is declining regardless of what his statistics say. If a bowler is mixing his pace effectively and the batsman looks uncomfortable, the wicket probability is rising — even if the bowler’s economy rate in the current spell is modest.
Length data adds another dimension. A bowler who is consistently hitting a good length is harder to score off than one who is erratic, but the erratic bowler may produce more wickets because the occasional short ball or full delivery surprises the batsman. In the over/under runs market, consistent length predicts lower scoring. In the wickets market, variation in length predicts more dismissals. These two statistical signals point in different directions, which is why separating the runs and wickets markets analytically is important even when the match winner market combines them.
Dot Ball Percentage: The Pressure Indicator
Dot ball percentage — the proportion of deliveries on which no runs are scored — is one of the most powerful statistical indicators in live cricket betting and one of the least used by casual bettors. A high dot ball percentage indicates that the bowling side is controlling the match, building pressure, and creating the conditions for a wicket.
In T20 cricket, the average dot ball percentage across all phases is roughly 38-42%. When a bowling side pushes the dot ball percentage above 50% during a sustained period — say, five or six consecutive overs — the batting side is under significant pressure. The run rate falls, the required rate rises, and the probability of a rash shot leading to a wicket increases. The match winner odds should shift toward the bowling side, and the next wicket market should shorten the price on the batsmen at the crease.
The value opportunity arises because dot ball percentage is a leading indicator of trouble, while wickets are a lagging indicator. The market reacts to wickets but often does not react to the dot ball pressure that precedes them. A batting side at 60/1 after eight overs looks healthy on the scorecard, but if the last four overs produced a dot ball percentage of 62%, the situation is more precarious than the scoreline suggests. The bettor who tracks dot ball percentage and recognises the building pressure can position themselves before the wicket falls and before the market adjusts.
In ODI cricket, the dot ball percentage is even more diagnostic because the innings is longer and pressure accumulates more gradually. A dot ball percentage above 55% during the middle overs of an ODI is a strong signal that the batting side is struggling, even if the scoreboard does not look immediately alarming. The middle-overs squeeze — discussed in other contexts — is measurable through dot ball percentage, and the statistic provides an objective basis for the subjective observation that “the batting side looks stuck.”
Partnership Graphs: The Shape of the Innings
Partnership data — how many runs each batting pair has added and at what rate — reveals the structural shape of an innings in a way that individual batting scores do not. A first-innings total of 280 in an ODI looks the same on the final scorecard whether it was achieved through three steady partnerships of 90 or through one huge partnership of 200 followed by a collapse. But the implications for the second innings — and for the betting markets — are entirely different.
An innings built on multiple partnerships suggests a good batting surface where most batsmen can score freely. The chasing team can expect similar conditions and the match winner market should reflect a balanced contest. An innings built on one dominant partnership followed by a collapse suggests either a deteriorating pitch or a bowling attack that found a way to exploit specific weaknesses after the dominant pair was separated. The chasing team’s task is less predictable, and the match winner market should price in higher variance.
For live betting during the second innings, the first partnership is the most important data point. If the chasing team’s opening partnership exceeds the first-innings opening partnership, it signals that conditions are favourable for batting and the chase is on track. If the chasing team’s opening partnership falls well short, the pitch may be deteriorating or the bowling may be more effective, and the chase is under early pressure. This simple comparison — first partnership in the first innings versus first partnership in the second — is a quick and reliable diagnostic for the match winner market in the early overs of a chase.
The Numbers Talk If You Listen Quietly
Cricket statistics are abundant, and the temptation is to use all of them. Resist that temptation. The bettor who tracks five statistics well will outperform the one who glances at twenty. Run rate gap, dot ball percentage, bowling speed variation, wagon wheel patterns, and partnership shape — these five indicators, read in real time and interpreted in context, provide a comprehensive picture of any live cricket match. They do not replace watching the game, but they structure what you see and give your observations a quantitative backbone. The statistics are not the edge itself. The edge is in knowing which ones to watch and what they mean when they change.
